Your Webflow Site is Live. Now What? A Guide to Understanding Your Audience with Analytics
You did it. After weeks of planning, designing, and building, your beautiful Webflow site is live. The animations are smooth, the content is compelling, and you’re proud of what you’ve launched into the world. You share the link, watch the first visitors roll in, and then… you wait.
Are people reading your blog posts? Are they finding the information they need? Is that brilliant case study you spent a week writing actually getting any views?
Without data, you’re flying blind. You’re making decisions based on guesswork, hoping you’re on the right track. But what if you could have a dashboard for your website one that tells you exactly what’s working, what isn’t, and most importantly, why?
That’s what analytics gives you. It’s not about drowning in spreadsheets; it’s about listening to your audience. This guide will walk you through how to start listening, using the tools already at your fingertips in Webflow and a few powerful free integrations. We’ll go from zero to data-driven, together.
The Analytics Toolkit: Your Three Key Dashboards
Many people get stuck thinking they have to choose between different analytics tools. The real magic happens when you use them together. Think of it like this:
- Webflow Analyze: Your car’s speedometer. It gives you a quick, essential overview of what’s happening right now.
- Google Analytics: Your onboard computer. It provides deep, detailed diagnostics about your journey where you came from, how long you stayed, and where you went next.
- Hotjar: Your dashcam. It lets you replay the journey from your visitor's perspective, seeing exactly where they looked, clicked, and got stuck.
Let's explore how to use all three to get a complete picture of your content’s performance.
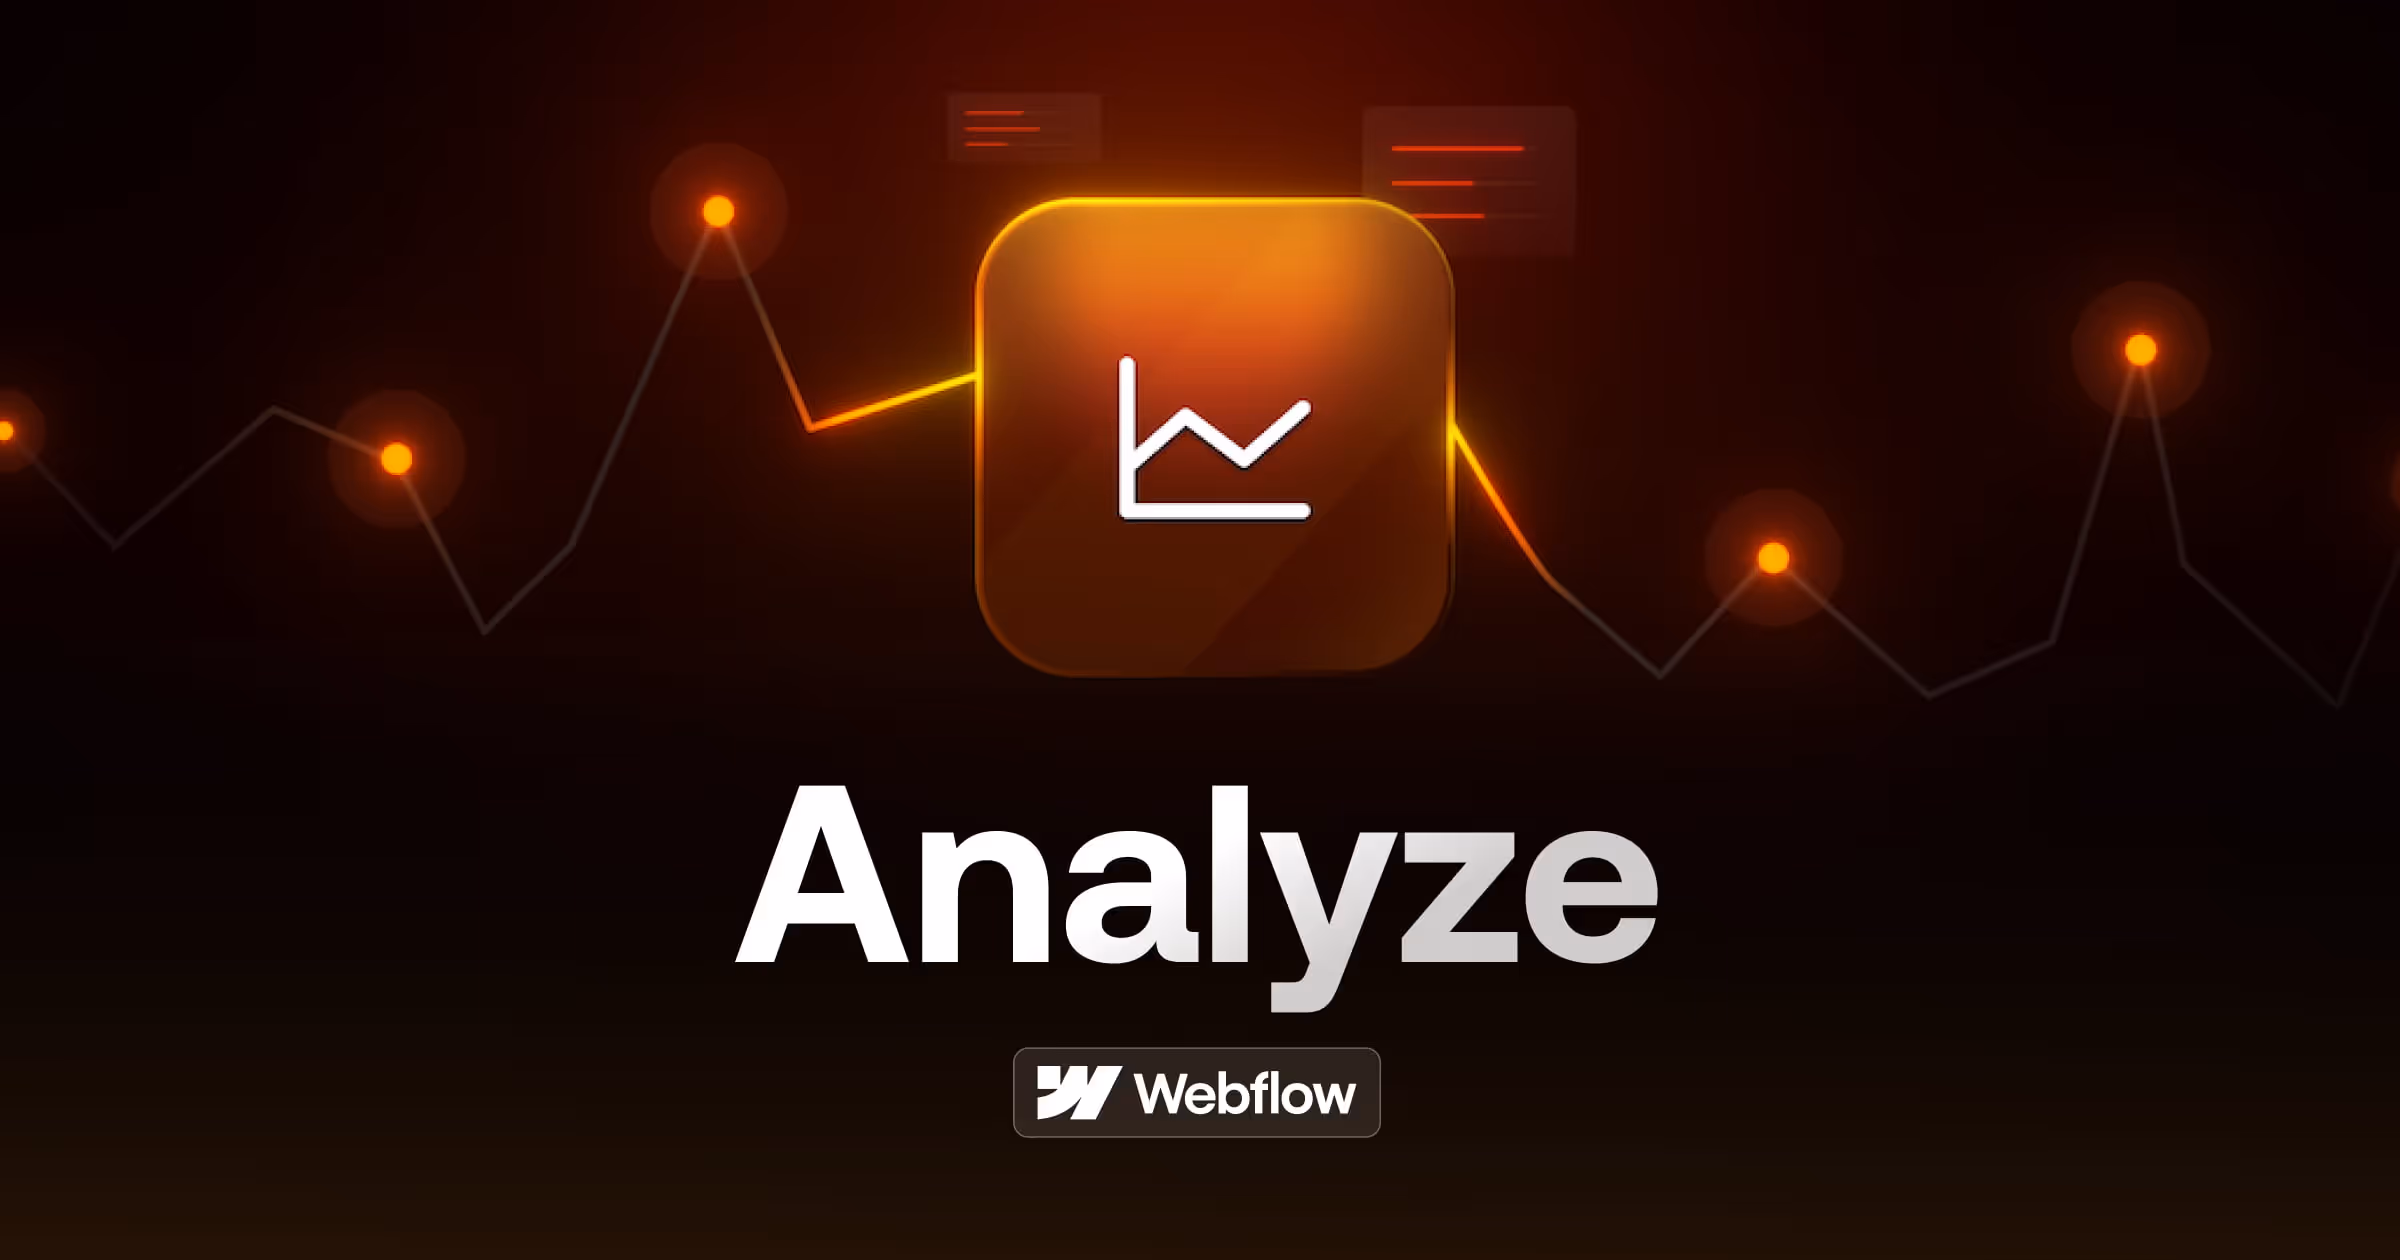
Part 1: The Quick Start with Webflow Analyze
Right out of the box, Webflow provides a simple, clean analytics dashboard called Webflow Analyze. For many, this is the perfect starting point. There’s no complex setup, no code to install it just works.
What it’s great for: Getting quick, high-level answers to your most immediate questions.
- What are my most popular pages? The "Top Pages" report instantly shows you which content is resonating most with your audience.
- How many people are visiting my site? Metrics like "Page Views" and "Unique Visitors" give you a clear pulse on your overall traffic.
- Where are my visitors coming from? The "Referrers" tab shows you which other websites are sending traffic your way.
How to get started: If you have a paid Webflow site plan, analytics are already running. You can find your dashboard in your Site Settings under the "Analytics" tab.
[Image Placeholder: Screenshot of the Webflow Analyze dashboard, highlighting the "Top Pages" and "Unique Visitors" metrics.]
This dashboard is fantastic for a daily check-in. If you just published a new blog post, you can see if it’s starting to get traction. But soon, you’ll start asking deeper questions, like "Why is this page so popular?" or "Why are people leaving that other page so quickly?"
That’s when it’s time to level up.
Part 2: Going Deeper with Google Analytics (GA4)
If Webflow Analyze is the speedometer, Google Analytics (GA4) is the full diagnostic report. It helps you move from "what" is happening to "how" and "why" it’s happening. This is the tool that content marketers and strategists rely on to understand user behavior on a granular level.
A common point of confusion is "Webflow Analyze vs. Google Analytics." It’s not a competition; they’re complementary.
Feature Webflow Analyze Google Analytics (GA4)Best ForQuick, at-a-glance traffic insights Deep, granular analysis of user behavior Setup Automatic (on paid plans)Requires simple setup Key Metrics Page Views, Unique Visitors, Top Pages Audience Demographics, Traffic Sources, User Flow, Events, Conversions Complexity Very Low Moderate Use Case "Which blog post got the most views today? "How are users from LinkedIn engaging with my blog content compared to users from Google?"
What Google Analytics unlocks for your content:
- Audience Insights: Discover the age, location, and interests of your readers. Are you reaching the right people?
- Traffic Sources: See exactly how people find you. Is your SEO paying off? Is your social media campaign driving clicks?
- User Behavior Flow: Trace the path users take through your site. Where do they enter? Which page do they visit next? Where do they drop off?
- Event Tracking: Measure specific interactions, like video plays, file downloads, or clicks on key links.
Setting up GA4 in Webflow is straightforward. You simply create a property in your Google Analytics account, get your Measurement ID, and paste it into the Integrations tab in your Webflow Site Settings. This small step opens up a universe of data. For a business looking to scale, leveraging this kind of in-depth Webflow Development insight is non-negotiable.
Part 3: Seeing What They See with Hotjar
Numbers tell you what happened. But to truly understand the why, you need to see your site through your users' eyes. This is where Hotjar comes in, offering qualitative data to complement Google Analytics' quantitative reports.
Hotjar allows you to generate heatmaps and watch recordings of real user sessions.
Heatmaps: These are visual overlays on your pages that show you where people click, move their mouse, and how far they scroll.
[Image Placeholder: A heatmap of a blog post, showing a bright red "hot spot" on a key call-to-action button and a clear scroll-depth line halfway down the page.]
A heatmap can give you an "aha moment" in seconds. You might discover:
- People are trying to click on an image that isn't linked.
- Your most important call-to-action is placed "below the fold" where most users never scroll.
- A headline is so compelling that everyone’s cursor hovers over it as they read.
Session Recordings: These are anonymous recordings of real user visits. You can watch as someone navigates your content, seeing their mouse movements, clicks, and scrolls in real-time. It’s the closest you can get to sitting next to your user. Watching just a few recordings can reveal friction points you never knew existed, like a confusing navigation menu or a form that's difficult to fill out.
Putting It All Together: A Real-World Example
Let's see how these three tools work in synergy to drive a content improvement strategy.
- The Signal (Webflow Analyze): You log in to your Webflow dashboard and see your new case study, "How We Helped a SaaS Client Double Their Signups," is in your top 5 most viewed pages. Great!
- The Deeper Story (Google Analytics): You open GA4 to investigate. You discover that 80% of the traffic to that page is coming from a LinkedIn post you shared. However, the "engagement rate" is low, and very few people are clicking through to your services page from the case study. The "what" is clear: people are interested, but they aren't taking the next step. But "why"?
- The "Aha Moment" (Hotjar): You set up a heatmap on the case study page. Within a day, you see a bright red cluster of clicks on the client’s logo at the top of the page. It's not a link, but people think it is and are trying to click it. You also watch a few session recordings and see users scroll right past your text-based call-to-action at the bottom and leave the page.
The Actionable Insight: Your visitors are curious to learn more about the client, but the unlinked logo is a dead end. Your call-to-action isn't grabbing their attention.
The Data-Driven Solution: You make two small changes. First, you make the client’s logo a link that opens their website in a new tab. Second, you change your call-to-action from a simple text link to a visually distinct button that reads "See How We Can Help You."
By using all three tools together, you've moved from a vague feeling ("I hope this case study works") to a precise, data-backed plan for improvement. This is how you conquer business challenges not with guesswork, but with insight.
Your First Data-Driven Content Checklist
Feeling inspired but not sure where to start? Here’s a simple, five-step plan to take your first steps.
- Check Your Baseline: Log into Webflow Analyze and identify your top 3 most popular blog posts or content pages.
- Install the Power Tools: Create and connect your Google Analytics and Hotjar accounts (both have generous free plans). It takes less than 15 minutes.
- Get Curious: Pick one of your popular pages and watch 3-5 Hotjar session recordings of users on that page. Don't look for anything specific; just observe.
- Spot a Pattern: Review the heatmap for that same page. Does it confirm what you saw in the recordings? Is there a clear point where people stop scrolling?
- Identify One Small Improvement: Based on your observations, what is one small change you could make to reduce friction or improve clarity? A better headline? A clearer button? A new internal link?
Making this a regular habit is a cornerstone of effective digital strategy and is often included in ongoing Site Maintenance plans to ensure a website doesn’t just look good, but constantly performs better.
Frequently Asked Questions
Does Webflow have analytics? Yes! All paid Webflow site plans include a built-in analytics dashboard called Webflow Analyze, which tracks key metrics like page views, unique visitors, and top pages right out of the box.
Is Webflow's native analytics enough? For a quick overview of your site's traffic, Webflow Analyze is excellent. However, for deeper insights into user behavior, traffic sources, and conversion tracking, integrating a tool like Google Analytics is highly recommended. The best approach is to use both.
Is it hard to set up Google Analytics with Webflow? Not at all. Webflow has a dedicated integration section in the Site Settings. You just need to paste your Google Analytics Measurement ID into the field, and you're ready to go. No custom code is required.
Can I use these tools to track my Webflow site search? Absolutely. You can configure Google Analytics to track what users are searching for on your site. This is an incredibly valuable source of insight, as it tells you exactly what your audience is looking for in their own words.
From Data to Direction
Analytics isn’t just about tracking numbers; it's about understanding people. By combining the simplicity of Webflow Analyze, the depth of Google Analytics, and the empathy of Hotjar, you can stop guessing and start building a content strategy that truly serves your audience.
Start small, stay curious, and let the data show you the way. Your audience is already telling you what they want all you have to do is listen.